

May 31, 2026
⯀
13
min


Want to grow your app without overspending? Focusing on the right app visibility metrics is your answer. By 2025, app store algorithms prioritize quality signals like retention and performance over just keywords. Tracking metrics like Search Visibility Score, Category Rankings, and Retention Rate helps you improve discoverability, rank higher, and keep users engaged.
Pro Tip: Regularly optimize your app store presence, monitor rankings daily, and focus on user retention to maintain strong visibility. These metrics work together to ensure long-term app success. Let’s dive into the details.
The Search Visibility Score gauges how easily users can find your app when searching with relevant keywords on the App Store or Google Play. It’s a way to measure incremental improvements in App Store Optimization (ASO) before they directly boost download numbers. With over 4 million apps competing for attention, this metric helps pinpoint gaps in organic growth early on.
What makes this score valuable is its ability to isolate ASO performance from external factors like ad campaigns or media coverage. As Hugh Kimura, Head of Content at Sensor Tower, puts it:
"Visibility Score is a great way to show incremental progress until your improvements gain critical mass".
This score not only reveals your app's current performance but also lays the groundwork for surpassing competitors.
This metric plays a central role in helping apps outshine competitors in search results. Visibility and installs often have an exponential relationship - a jump in score from 10 to 15 generates far more impressions than a move from 5 to 10. If your visibility improves but downloads remain stagnant, it’s a sign to evaluate your creative assets and user ratings.
Take the mobile game Draw Climber as an example. Launched on January 24, 2020, its visibility score climbed from 85 on February 11 to 87.6 on February 12, and finally reached 91.9 on February 13. That same day, it hit number one on the Top Charts. This demonstrates how visibility directly correlates with success.
The Search Visibility Score is a composite metric calculated through algorithms that consider factors like indexed keywords, ranking positions, keyword search volume, and category rankings. Each platform has its own scoring system: MobileAction uses a 0–100 scale for top-50 keywords, while Sensor Tower employs an open-ended scale.
| Metric Component | Description | Impact on Score |
|---|---|---|
| Keyword Rankings | Position for target search terms | High: Main driver of discoverability |
| Search Volume | Frequency of keyword searches | High: High-volume keywords weigh more |
| Download Velocity | Speed of installs (24–72 hours) | Medium-High: Signals popularity to algorithms |
| Category Ranking | Position in specific store charts | Medium: Affects "Browse" visibility |
It’s crucial to track scores by country, as search visibility can vary greatly across regional app stores. For example, a 19% score means your app’s visibility is better than 19% of other apps in its category.
Monitoring rankings daily is essential to identify issues like algorithm changes or sudden drops in reviews. Top-performing apps typically update every 18 days to sustain visibility and ranking stability.
Focus on keywords where your app has a realistic chance of breaking into the top 10, instead of chasing high-volume keywords that are out of reach. Additionally, refresh your metadata every 4 to 6 weeks to replace poorly performing keywords that rank outside the top 100.
App Store category rankings act as leaderboards, showcasing how your app stacks up in categories like Finance, Health & Fitness, and Games. They reflect an app's market position and influence. As Olivia Doboaca, Growth Marketing Manager at AppFollow, puts it:
"Top-chart rankings are leaderboards every exec fixates on the minute your ad dollars land".
These rankings are more than just a badge of credibility. They play a crucial role in driving Organic Browse traffic on the App Store and Explore traffic on Google Play. Essentially, category rankings serve as a secondary discovery channel for organic traffic, making them a key metric for boosting visibility and growth.
Strong category rankings create a snowball effect: better visibility leads to more downloads, which in turn improves rankings, further increasing visibility. For mid-tier games, breaking into the top 50 in a key region can lead to a 7% to 12% increase in organic installs, day-over-day.
One of the most critical factors influencing rankings is download velocity - the speed at which your app gains downloads over a rolling 3–7 day period. Apps with ratings above 4.5 stars tend to perform significantly better, attracting three times more installs on average. In niche categories, hitting the top 100 often requires around 3,000 daily installs.
Understanding category rankings is one thing, but accurate tracking is where the real work begins. These rankings are determined by monitoring your app's position in the Top Free, Top Paid, and Top Grossing charts. Unlike search rankings, which focus on keyword relevance, these charts prioritize performance metrics like download velocity, total downloads, and revenue.
| Metric | Impact on Category Ranking | Tracking Frequency |
|---|---|---|
| Download Velocity | High (Main driver of rank changes) | Daily |
| User Retention | Medium (Indicates app quality) | Weekly |
| Average Rating | Medium (Affects conversion rates) | Daily |
| Revenue | High (Relevant for "Top Grossing") | Daily |
Tracking daily is essential for staying ahead of performance shifts.
Choosing the right category is equally important. Niche categories allow apps to rank higher with fewer downloads, while broader categories offer more exposure but come with intense competition. If you’re struggling in a crowded category, switching to a niche where you can secure a top 10 spot often yields better visibility than being lost in the top 200 of a broader category.
Daily monitoring of category rankings is critical to catching even small changes. A drop of just 10 positions can signal issues like negative reviews or a slowdown in user acquisition. Set alerts to notify you of significant rank changes, so you can act quickly.
During major updates or promotional campaigns, daily tracking becomes even more crucial. The algorithm can respond to changes within 24–48 hours. To maximize impact, plan campaigns to drive a surge in installs over 48–72 hours, aiming for at least a 30% increase in Day-1 installs compared to the previous week’s average. This signals momentum to the algorithm and can push your app higher in the charts.
Retention rate tracks the percentage of users who return to your app after installing it. As Monique Ellis, Content Marketing Manager at Similarweb, puts it:
"Retention is the clearest signal that your app delivers repeatable value. Watching Day 1, Day 7, and Day 30 behavior reveals where users fall off and which experiences pull them back in".
This metric is a key indicator of whether your app meets user needs and achieves product-market fit. Interestingly, about 25% of mobile apps are used only once after being downloaded. That means three out of four apps manage to bring users back at least once - but keeping them engaged over time is the real challenge. Retention not only highlights user satisfaction but also plays a role in improving App Store Optimization (ASO) performance.
Retention rates send a powerful quality signal to app store algorithms. If users abandon your app quickly, it suggests low quality to these platforms. On the flip side, strong retention rates show that your app provides ongoing value, indirectly boosting your search rankings. Apps with high ratings (above 4.5 stars) tend to secure three times more installs.
The financial impact of retention is equally compelling. A 5% increase in customer retention can drive profit growth between 25% and 95%. Additionally, a stickiness ratio (calculated as DAU/MAU) of 20% or higher signals frequent user engagement, which further enhances your app's organic visibility. In short, retention is a cornerstone of both user satisfaction and long-term ASO success.
Retention can be calculated using two main methods.
As Roman, Marketing Director at Tenjin, explains:
"The most common metric is Day 1 retention. It's one of the first signals that helps you identify if a source is good or not. In my opinion, it's better when the retention number is conservative".
Retention is often tracked at intervals like Day 1, Day 7, and Day 30. On average, 25% of users return on Day 1, but this drops to 12% by Day 7 and about 5% by Day 30. For context, news apps tend to see long-term retention rates of 8.50% on Android and 7.15% on iOS, while utility apps often fall below 1%.
Short-term retention (Day 1 and Day 7) should be monitored weekly to catch sudden declines caused by bugs or mobile app UI/UX design issues. For long-term trends (Day 30+), monthly or quarterly reviews can provide a clearer picture of sustained engagement.
Breaking down retention by traffic source is also useful. Users acquired through Search tend to have higher retention rates than those from Browse or Explore, as they often come with a specific intent. This data can help fine-tune your acquisition strategies and allocate budgets more effectively.
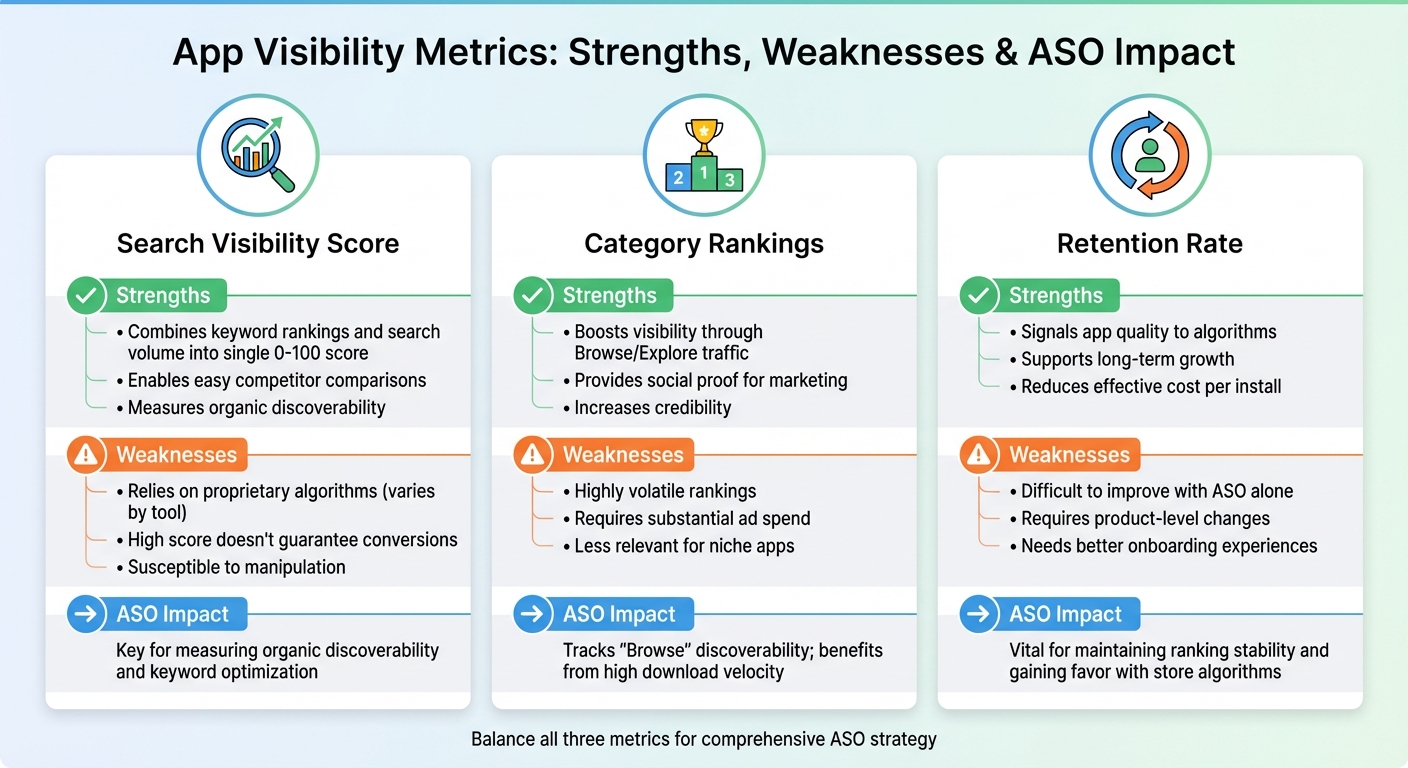
App Visibility Metrics Comparison: Search Visibility, Category Rankings, and Retention Rate
Let’s break down the strengths and challenges of each metric to better understand how they impact app performance and strategy. Each metric has its own role, offering insights that guide resource allocation and set realistic expectations.
Search Visibility Score is a handy metric that combines keyword rankings and search volume into a single number, usually on a 0–100 scale. This makes it easy to compare your app against competitors. However, Igor Blinov, ASO Director, points out:
"Visibility metrics, while valuable, can be susceptible to manipulation due to their relative nature. Since they reflect trends compared to competitors and chosen keywords, the perceived direction can be influenced by these factors".
The score depends on proprietary algorithms, which vary across tools. Plus, a high score won’t automatically translate to app installs if elements like icons, screenshots, or descriptions fail to convert users.
Category Rankings are another key metric, offering high visibility and a sense of credibility that can boost marketing efforts. These rankings help apps get discovered by users who are browsing without a specific search in mind. But there’s a catch: rankings are heavily influenced by download velocity, often requiring substantial ad spend to climb the charts. Jessica Spivey, Senior ASO Expert, adds:
"App stores factor in your establishment, app vitals, and conversion rates - poor performance harms ranking".
Finally, Retention Rate stands out as a critical measure of user engagement and long-term growth. It’s a strong indicator of app quality and helps maintain ranking stability, which reduces the effective cost per install. The downside? Retention is tough to improve through ASO tweaks alone - it requires deeper mobile app solutions for engagement and better onboarding experiences.
| Metric | Strengths | Weaknesses | ASO Impact |
|---|---|---|---|
| Search Visibility Score | Combines keyword rankings and volume; supports competitor comparisons | Relies on proprietary algorithms; may not reflect conversion success | Key for measuring organic discoverability and keyword optimization |
| Category Rankings | Boosts visibility; offers social proof for marketing | Volatile; influenced by ad spend and less relevant for niche apps | Tracks "Browse" discoverability and benefits from high download velocity |
| Retention Rate | Signals app quality; supports long-term growth | Hard to improve with ASO alone; requires product-level changes | Vital for maintaining ranking stability and gaining favor with store algorithms |
Balancing these metrics helps align ASO strategies with broader marketing and product goals, ensuring a more comprehensive approach to app success.
When selecting visibility metrics for your app store optimization (ASO) strategy, focus on those that align with your primary goals. If improving search rankings is your aim, prioritize metrics like keyword rankings, keyword relevancy, and download velocity. On the other hand, if your focus is on user retention, keep an eye on 30-, 60-, and 90-day retention rates and the DAU/MAU ratio - these metrics signal to app stores that your app delivers ongoing value to users.
Retention metrics build on acquisition data, offering proof of your app's quality and its potential for long-term success. In a holistic ASO strategy, visibility and retention metrics are interconnected. Metrics like Search Visibility Score and Category Rankings help attract new users, while strong retention rates and positive reviews reinforce your app’s position.
Avoid focusing solely on vanity metrics, such as total downloads or cost per install. Instead, balance download volume with metrics like "Chance" - the likelihood of ranking in the top 10 for your category. For optimal results, target keywords with a search volume above 30 and a difficulty score below 60. Also, keep your app’s technical performance in check; for instance, Apple maintains a crash rate threshold of less than 1%, and exceeding this limit can undermine even the best metadata efforts.
A winning ASO strategy combines regular metadata updates with consistent app releases - ideally every 18 to 45 days - to demonstrate that your app is active and well-maintained. Additionally, tracking conversion rates by traffic source allows you to allocate resources where they’ll have the greatest impact.
Take advantage of tools like AI-generated tags and in-app event indexing to boost discoverability. For example, Apple now automatically generates discovery tags based on your metadata, creating new search opportunities you can optimize. Together, metrics like search visibility, category rankings, and retention rates form a cohesive strategy to secure long-term ASO success. Leveraging innovations such as AI-generated tags can further strengthen your app’s presence in a competitive market.
At Dots Mobile, we apply these insights to ensure our clients' apps thrive in the ever-changing digital space.
To boost your app's Search Visibility Score, it's all about refining your App Store Optimization (ASO) efforts. Start by fine-tuning your app's metadata - this includes the title, subtitle, and keyword field. Use relevant, high-intent keywords that align with what your target audience is searching for. This step makes your app show up in more relevant search results.
Beyond keywords, focus on the bigger picture. Strong download numbers, positive reviews, and high ratings all contribute to your app's credibility. Regular updates are also essential - not just for fixing bugs but for improving performance and keeping users engaged. These updates send a clear signal to app stores that your app is worth recommending.
Lastly, keep an eye on your app's performance metrics. Use the data to tweak your ASO strategy as needed. This ongoing process is key to maintaining your app's visibility and ensuring long-term growth.
App Store category rankings depend on several key factors that directly impact an app’s visibility and overall performance. Here's a closer look at what matters most:
By prioritizing these elements, you can improve your app’s visibility and ranking within its category. In a crowded app marketplace, standing out is all about consistently delivering quality and value.
Retention rate plays a crucial role in an app's success. It reflects how well your app keeps users engaged over time. A higher retention rate often translates to a boost in lifetime value (LTV) and improved return on investment (ROI), making it a strong predictor of long-term growth.
To keep users coming back, focus on delivering personalized experiences, sending well-timed and relevant push notifications, and simplifying your onboarding process to make it both intuitive and engaging. These efforts can help create lasting connections with users, encouraging them to stick with your app.


